DEXi-CSC
DEXi is a computer program for creating multi-attribute decision models (MADMs) that:
- allows interactive development of qualitative multi-attribute decision models
- allows comparisons of differing attribute options
- can be used to support complex decision-making tasks, i.e. selection of best option
from a range of possible options
- is used to create hierarchical, multi-attribute models from the decomposition of
problems into smaller, less complex sub-problems that may be solved more easily
MADMs, like DEXi, are well suited to use in assessing crop production systems
that are reliant on complex networks of interactions and trade-offs between biotic,
abiotic and economic components.
DEXi-CSC has been developed to assess systems such as the CSC's integrated cropping
system directly against standard commercial practice over a six year croping sequence.
The effect of cropping treatment was assessed according to the responses of a suite of
indicators which were used to parameterise a qualitative multi-attribute model.
Scenarios were run to test whether the integrated cropping system achieved greater
levels of overall sustainability relative to standard commercial practice.
This case study demonstrates the value of a whole-systems approach using qualitative
multi-attribute modelling for the assessment of existing cropping systems and for
predicting the likely impact of new management interventions on arable sustainability.

DEXi-CSC is comprised of 97 input variables representing the basic biotic, abiotic and
financial indicators of the arable cropping system (see DEXi-CSC input attributes).
Input variables are aggregated into a
hierarchical tree with a total of 332 aggregate variables.
Overall sustainability,
the top level, is the aggregate of two, second level branches
Environmental sustainability and
Economic sustainability.
Environmental sustainability
is the aggregate of three, third level branches
(
Biodiversity,
Losses and
Resource use).
Economic sustainability
is the aggregate of two, third level branches
(
Viability and
Real profitability).
These branches reflect the main goals of the CSC platform:
- maintainence of yield whilst enhancing biodiversity (in-field and field margin dicot
weeds that benefit invertebrates)
- increasing resource use efficiency (reduce reliance on non-renewables)
- minimise losses via leaching, run-off, erosion and greenhouse gas emissions
DEXi-CSC input attributes
| 1. Average market price |
50. Price of crop seed |
| 2. Average price of fuel |
51. Price of desiccants |
| 3. Baling fuel |
52. Price of fungicide |
| 4. Carting fuel |
53. Price of FYM |
| 5. Connectivity of semi-natural habitats |
54. Price of herbicide |
| 6. Crop competition |
55. Price of insecticide |
| 7. Compost fuel |
56. Price of irrigation |
| 8. Conditions for spray drift |
57. Price of lime |
| 9. Conditions for volatilisation |
58. Price of mineral K fertiliser |
| 10. Cover crop fuel |
59. Price of mineral N fertiliser |
| 11. Crop cover |
60. Price of mineral P fertiliser |
| 12. Crop fuel |
61. Price of molluscicide |
| 13. Crop rotation diversity/intensity |
62. Price of seed treatment |
| 14. Crop type |
63. Price of soil sterilants |
| 15. Deep inversion tillage fuel |
64. Price of straw |
| 16. Desiccants AI/rate |
65. Price of trace elements |
| 17. Desiccant fuel |
66. Price of undersow seed |
| 18. Environmental subsidies |
67. Product quality |
| 19. Field margin floral diversity |
68. Production risk |
| 20. Field margin structure |
69. Proportion of gross margin due to main crop |
| 21. Field properties |
70. Rate compost |
| 22. Fungicide AI/rate |
71. Rate FYM |
| 23. Fungicide fuel |
72. Rate lime |
| 24. FYM fuel |
73. Rate mineral K fertiliser |
| 25. Harvesting fuel |
74. Rate mineral N fertiliser |
| 26. Herbicide AI/rate |
75. Rate mineral P fertiliser |
| 27. Herbicide fuel |
76. Rate straw |
| 28. Insecticide AI/rate |
77. Rate trace elements |
| 29. Insecticide fuel |
78. Rate undersow |
| 30. Inversion tillage fuel |
79. Ratio semi-natural: cultivated land |
| 31. Irrigation availability |
80. Requirement for agricultural equipment |
| 32. Irrigation fuel |
81. Seed cover crop |
| 33. Irrigation requirement |
82. Seed rate crop |
| 34. Labour hourly wage |
83. Seed treatment AI/rate |
| 35. Lime fuel |
84. Seed undersow |
| 36. Mineral fertilisers fuel |
85. Soil cover at pesticide application |
| 37. Molluscicide AI/rate |
86. Soil sterilants AI/rate |
| 38. Molluscicide fuel |
87. Soil sterilant fuel |
| 39. N soil residual |
88. Soil type |
| 40. Non-environmental subsidies |
89. Straw chopping fuel |
| 41. Non-inversion tillage fuel |
90. Straw selling price |
| 42. Number of hours |
91. Straw yield |
| 43. P soil residual |
92. Stubble/straw management |
| 44. Pathogen pressure |
93. Tillage intensity |
| 45. Pest pressure |
94. Trace elements fuel |
| 46. Post-plant herbicide AI/rate |
95. Undersow fuel |
| 47. Precipitation |
96. Weather conditions |
| 48. Price of compost |
97. Weed management strategy |
| 49. Price of cover crop seed |
|
The scales used for each input and aggregate function are available
here.
An interactive Java implemntation of the
DEXi-CSC model can be accessed here.
Interpreting DEXi Evaluations
Viewing and interpreting several
evaluations of a DEXi tree with over 300
aggregate functions can be challenging. To aid interpretation we use two types of visual
representation of the output i.e. heat maps and radar plots.
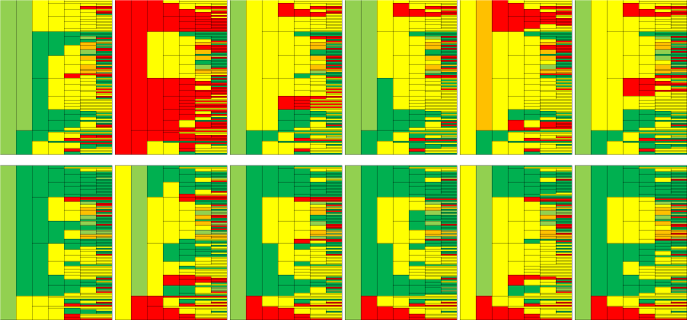
DEXi-CSC heat map
These heat maps show the top seven layers of evaluation output for each of the six crops in the
CSC the rotation. Input data is aggregated across six years of the first crop rotation.
As a contrast conventional potato performs poorly whilst Integrated bean performs well.
|
Bean |
Potato |
Spring barley |
Winter barley |
Winter oilseed rape |
Winter wheat |
| Conventional |
|
| Integrated |
| |

|
| |
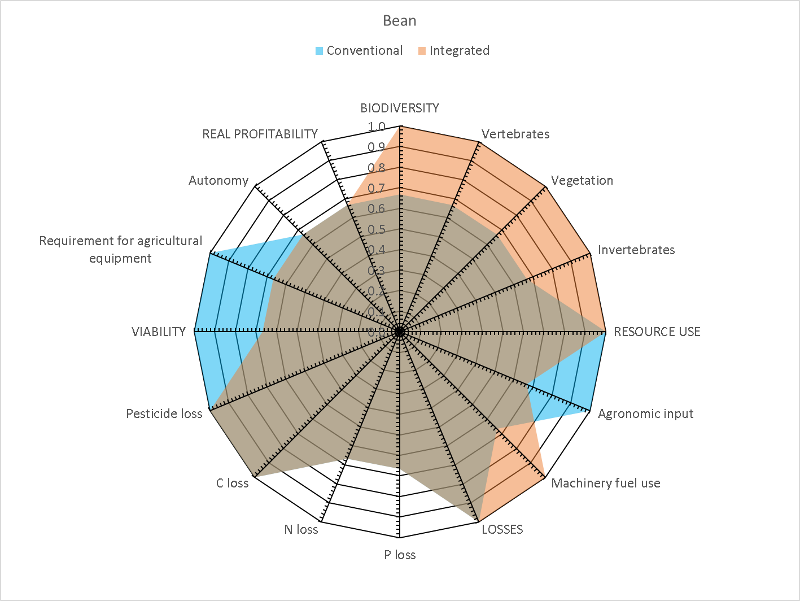
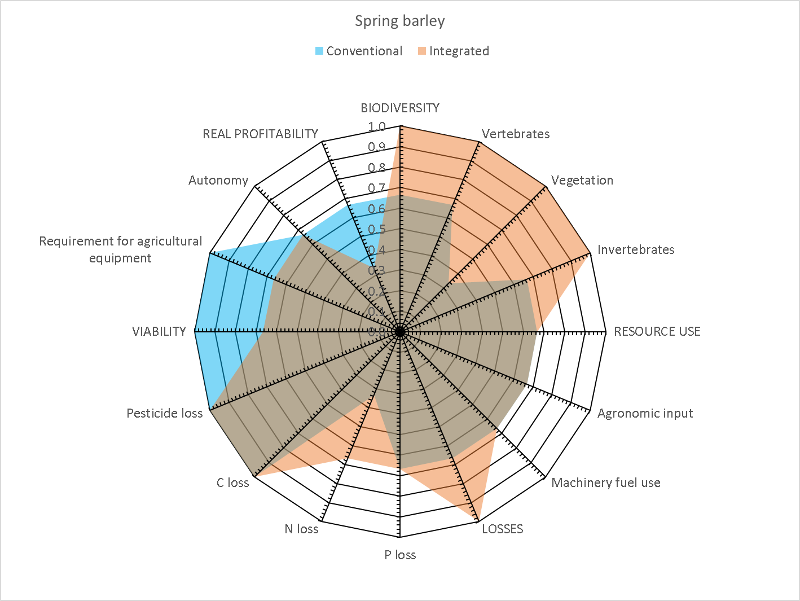
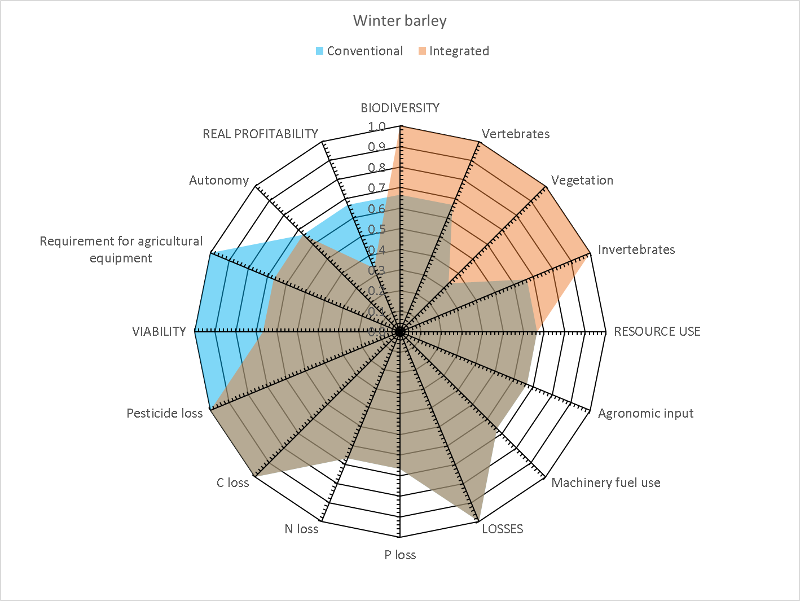
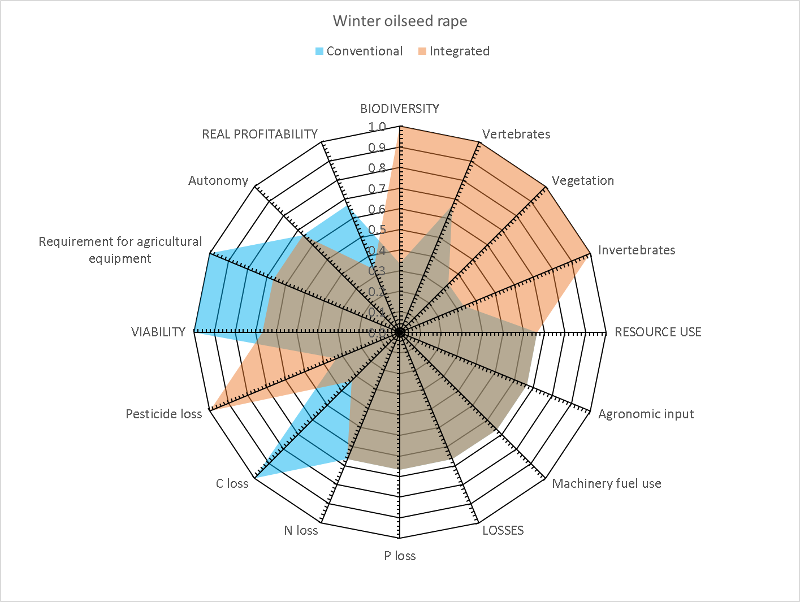
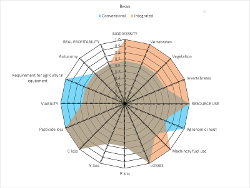
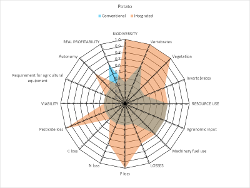
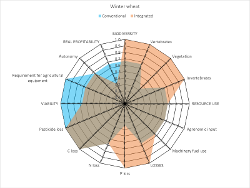
DEXi-CSC radar plots
These radar plots show selected attributes from layers three and four of evaluation output for
each of the six crops in the CSC the rotation.
Input data is aggregated across six years of the first crop rotation.
| Bean |
Potato |
Spring barley |
|
|

|
| Winter barley |
Winter oilseed rape |
Winter wheat |

|

|
|
| |
| Integrated |
Overlap |
Conventional |
|
DEXi web site